

Tableau
Tableau is a leading data visualization and analytics platform that empowers individuals and organizations to turn raw data into compelling stories and actionable insi...
Tags:AI Data AnalysisData analysis
What is Tableau?
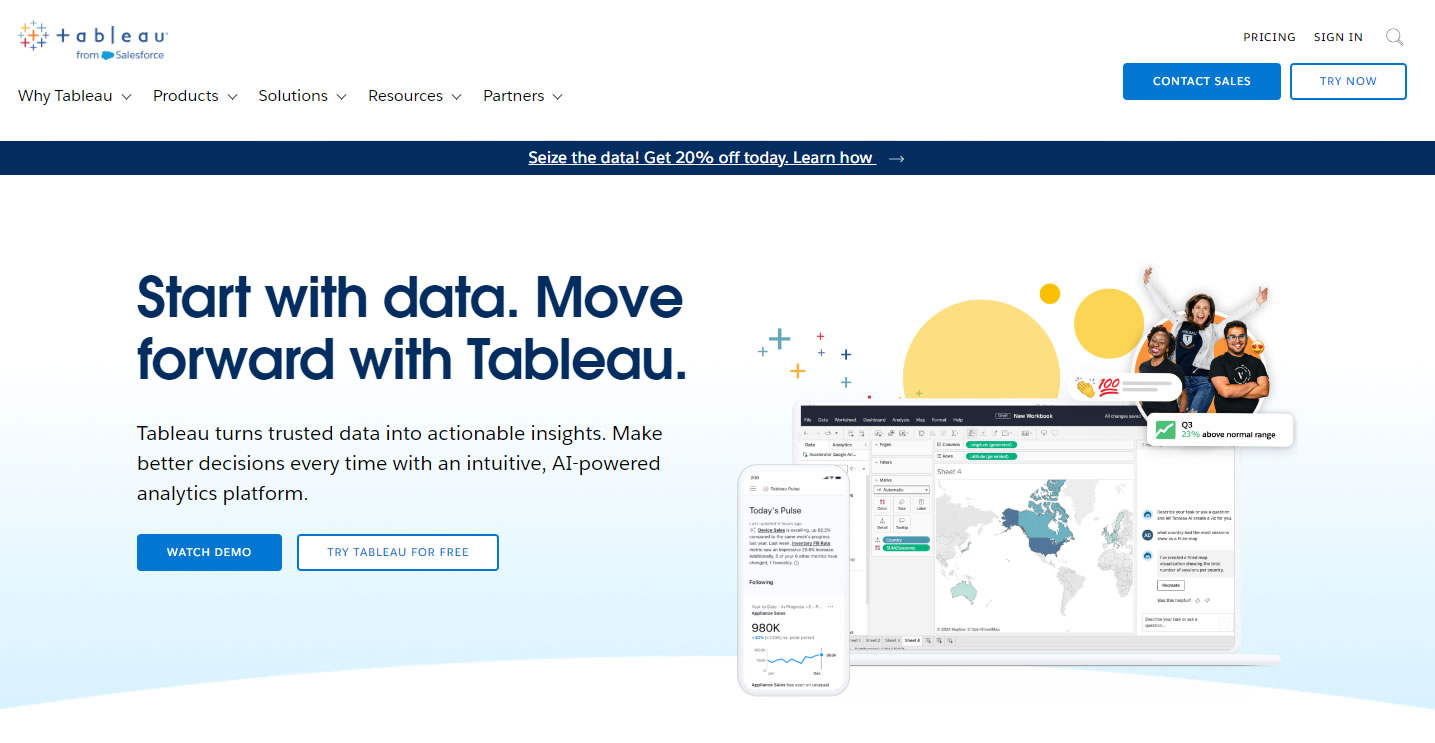
Tableau is a leading data visualization and analytics platform that empowers individuals and organizations to turn raw data into compelling stories and actionable insights. Developed by Tableau Software, Inc., the platform is widely recognized for its intuitive drag-and-drop interface, which allows users to connect to various data sources, create interactive dashboards, and share insights easily. Tableau supports a wide range of data sources, including databases, spreadsheets, cloud storage, and social media feeds, making it a versatile tool for data analysis and visualization.
Key Features:
1.Drag-and-Drop Interface: Tableau’s user-friendly interface allows users to create visualizations and dashboards without needing extensive technical skills. Users can simply drag fields onto the canvas to start creating charts, graphs, maps, and more.
2.Data Connection: It can connect to almost any data source, including relational databases, Excel files, cloud storage services like Google Drive and Dropbox, and even social media platforms. This flexibility makes it easy to integrate data from various sources into a single dashboard.
3.Interactive Dashboards: Tableau allows users to create interactive dashboards that can filter, drill down, and zoom into data, providing deeper insights into the underlying trends and patterns. These dashboards can be shared with others, fostering collaboration and discussion.
4.Mobile Access: Tableau Public and Tableau Reader offer mobile versions, allowing users to view and interact with dashboards on smartphones and tablets. This feature ensures that insights can be accessed anytime, anywhere.
5.Sharing and Collaboration: Tableau provides robust sharing and collaboration features, enabling users to publish dashboards to the web, embed them in websites, or share them directly via email. Team members can collaborate in real time, contributing to a collective understanding of the data.
Target Audience:
1.Business Analysts and Data Analysts: Professionals who need to analyze data and present findings to stakeholders often rely on Tableau for its powerful data visualization capabilities.
2.Data Scientists: While Tableau may not replace dedicated statistical analysis tools, it serves as a complementary tool for data scientists to communicate their findings in a more digestible format.
3.Marketers: Marketers use Tableau to track campaign performance, customer behavior, and other key metrics, helping them make data-driven decisions.
4.Nonprofits and Educational Institutions: Organizations in these sectors use Tableau to visualize fundraising progress, student performance, and other important metrics, facilitating transparency and accountability.
5.Government Agencies: Government bodies utilize Tableau to monitor public services, allocate resources, and report on policy outcomes.


