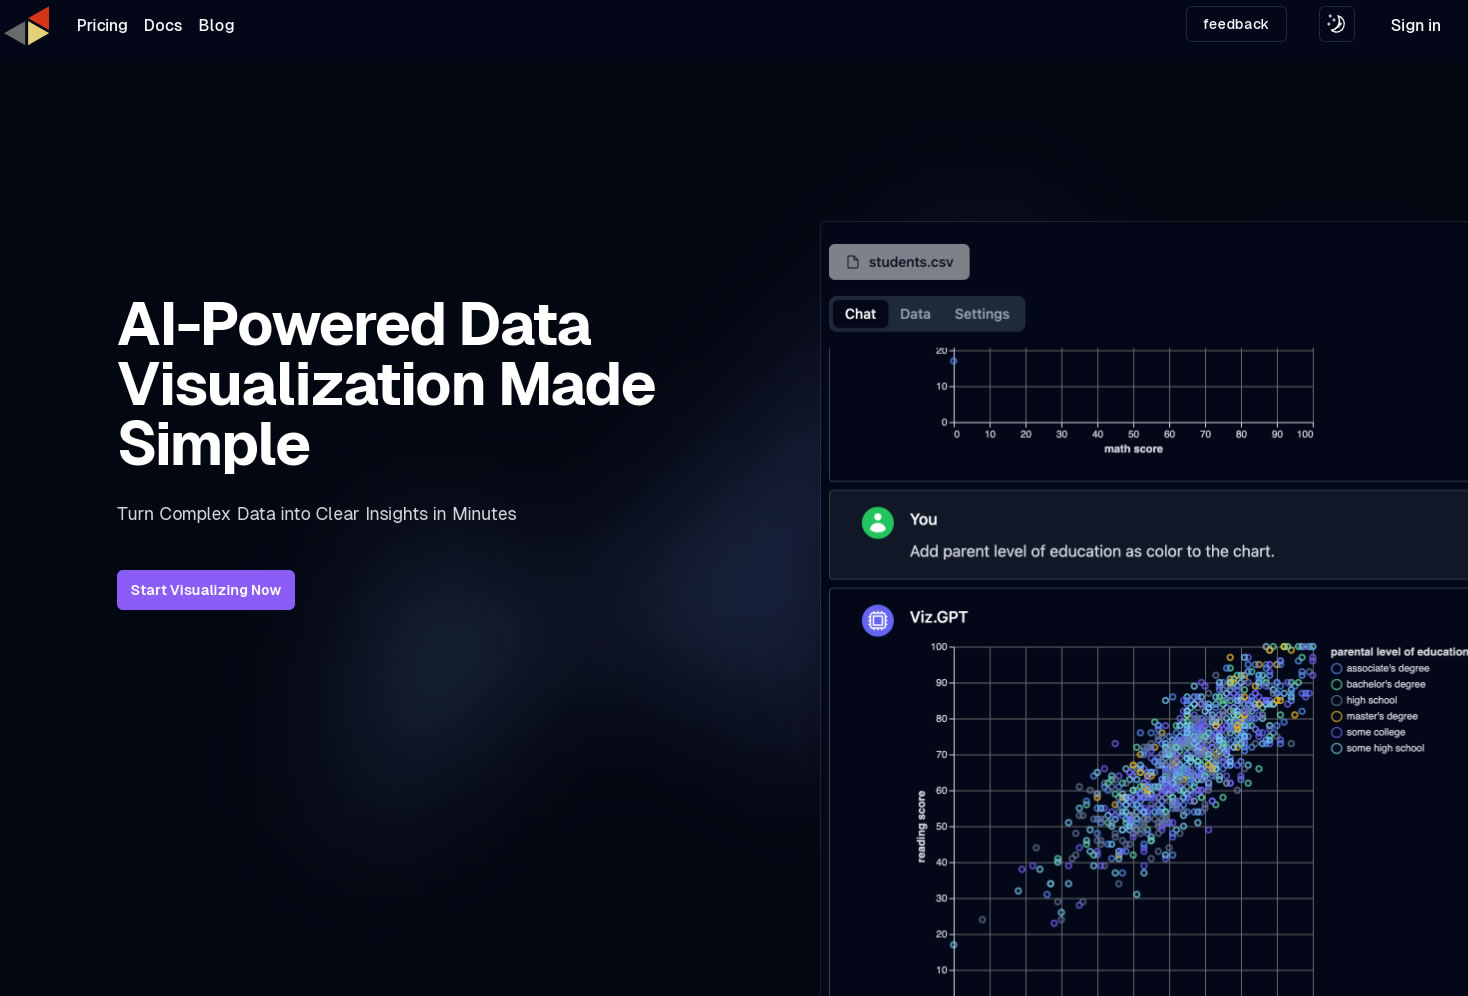


VizGPT
VizGPT provide easy-to-use data tables that allow you to transform and profile your data with ease.
Tags:AI Data AnalysisData analysis
A Powerful Intelligent Data Table. VizGPT provide easy-to-use data tables that allow you to transform and profile your data with ease.
Features:
1.Data Visualization:
-Transforms complex data into easily understandable visuals such as charts, graphs, and maps.
-Supports various types of visualizations like bar charts, line graphs, pie charts, scatter plots, and heat maps.
2.Natural Language Processing (NLP):
-Allows users to generate visualizations through natural language queries.
-Understands context and provides relevant visual representations based on user input.
3.Customization:
-Offers extensive customization options for visualizations, including color schemes, labels, and formatting.
-Enables users to tailor visual outputs to match their specific needs and preferences.
4.Integration:
-Easily integrates with various data sources such as databases, spreadsheets, and APIs.
-Compatible with popular data analysis and business intelligence tools.
5.Collaboration:
-Facilitates collaboration by allowing users to share visualizations with team members.
-Includes features for commenting, editing, and real-time updates.
6.User-Friendly Interface:
-Intuitive interface designed for users with varying levels of technical expertise.
-Provides guided tutorials and support to help users get started quickly.
7.Automation:
-Automates repetitive tasks and updates visualizations dynamically as new data is added.
-Supports scheduling and alerts for regular updates.
8.Security:
-Ensures data privacy and security with robust encryption and access control measures.
-Complies with industry standards and regulations for data protection.
Target Audience:
1.Data Analysts:Professionals who need to create and analyze visual representations of data for insights and decision-making.
2.Business Intelligence Teams:Teams focused on gathering, processing, and visualizing business data to inform strategy and operations.
3.Researchers and Academics:Individuals who require sophisticated visual tools to present research findings and data analyses.
4.Marketing Professionals:Users who need to visualize market trends, customer data, and campaign performance for reporting and strategic planning.
5.Executives and Managers:Decision-makers who rely on clear and concise visual data representations for strategic planning and performance tracking.
6.Educators and Students:Teachers and learners who use visual aids to understand and explain complex concepts and data.
7.Developers:Software developers and engineers who integrate data visualization capabilities into their applications and projects.


